These three reports help you plan your schedule. You'll find them under Reports → Sessions. They're available in the Pro and Premium plans.
Occupancy (group)
How full your group sessions are: the number of participants divided by the maximum number of spots. A booking counts whether or not the person showed up.
- Sessions and Participants: the number of group sessions and people booked
- Avg per session: the average per session
- Occupancy: the percentage of available spots taken
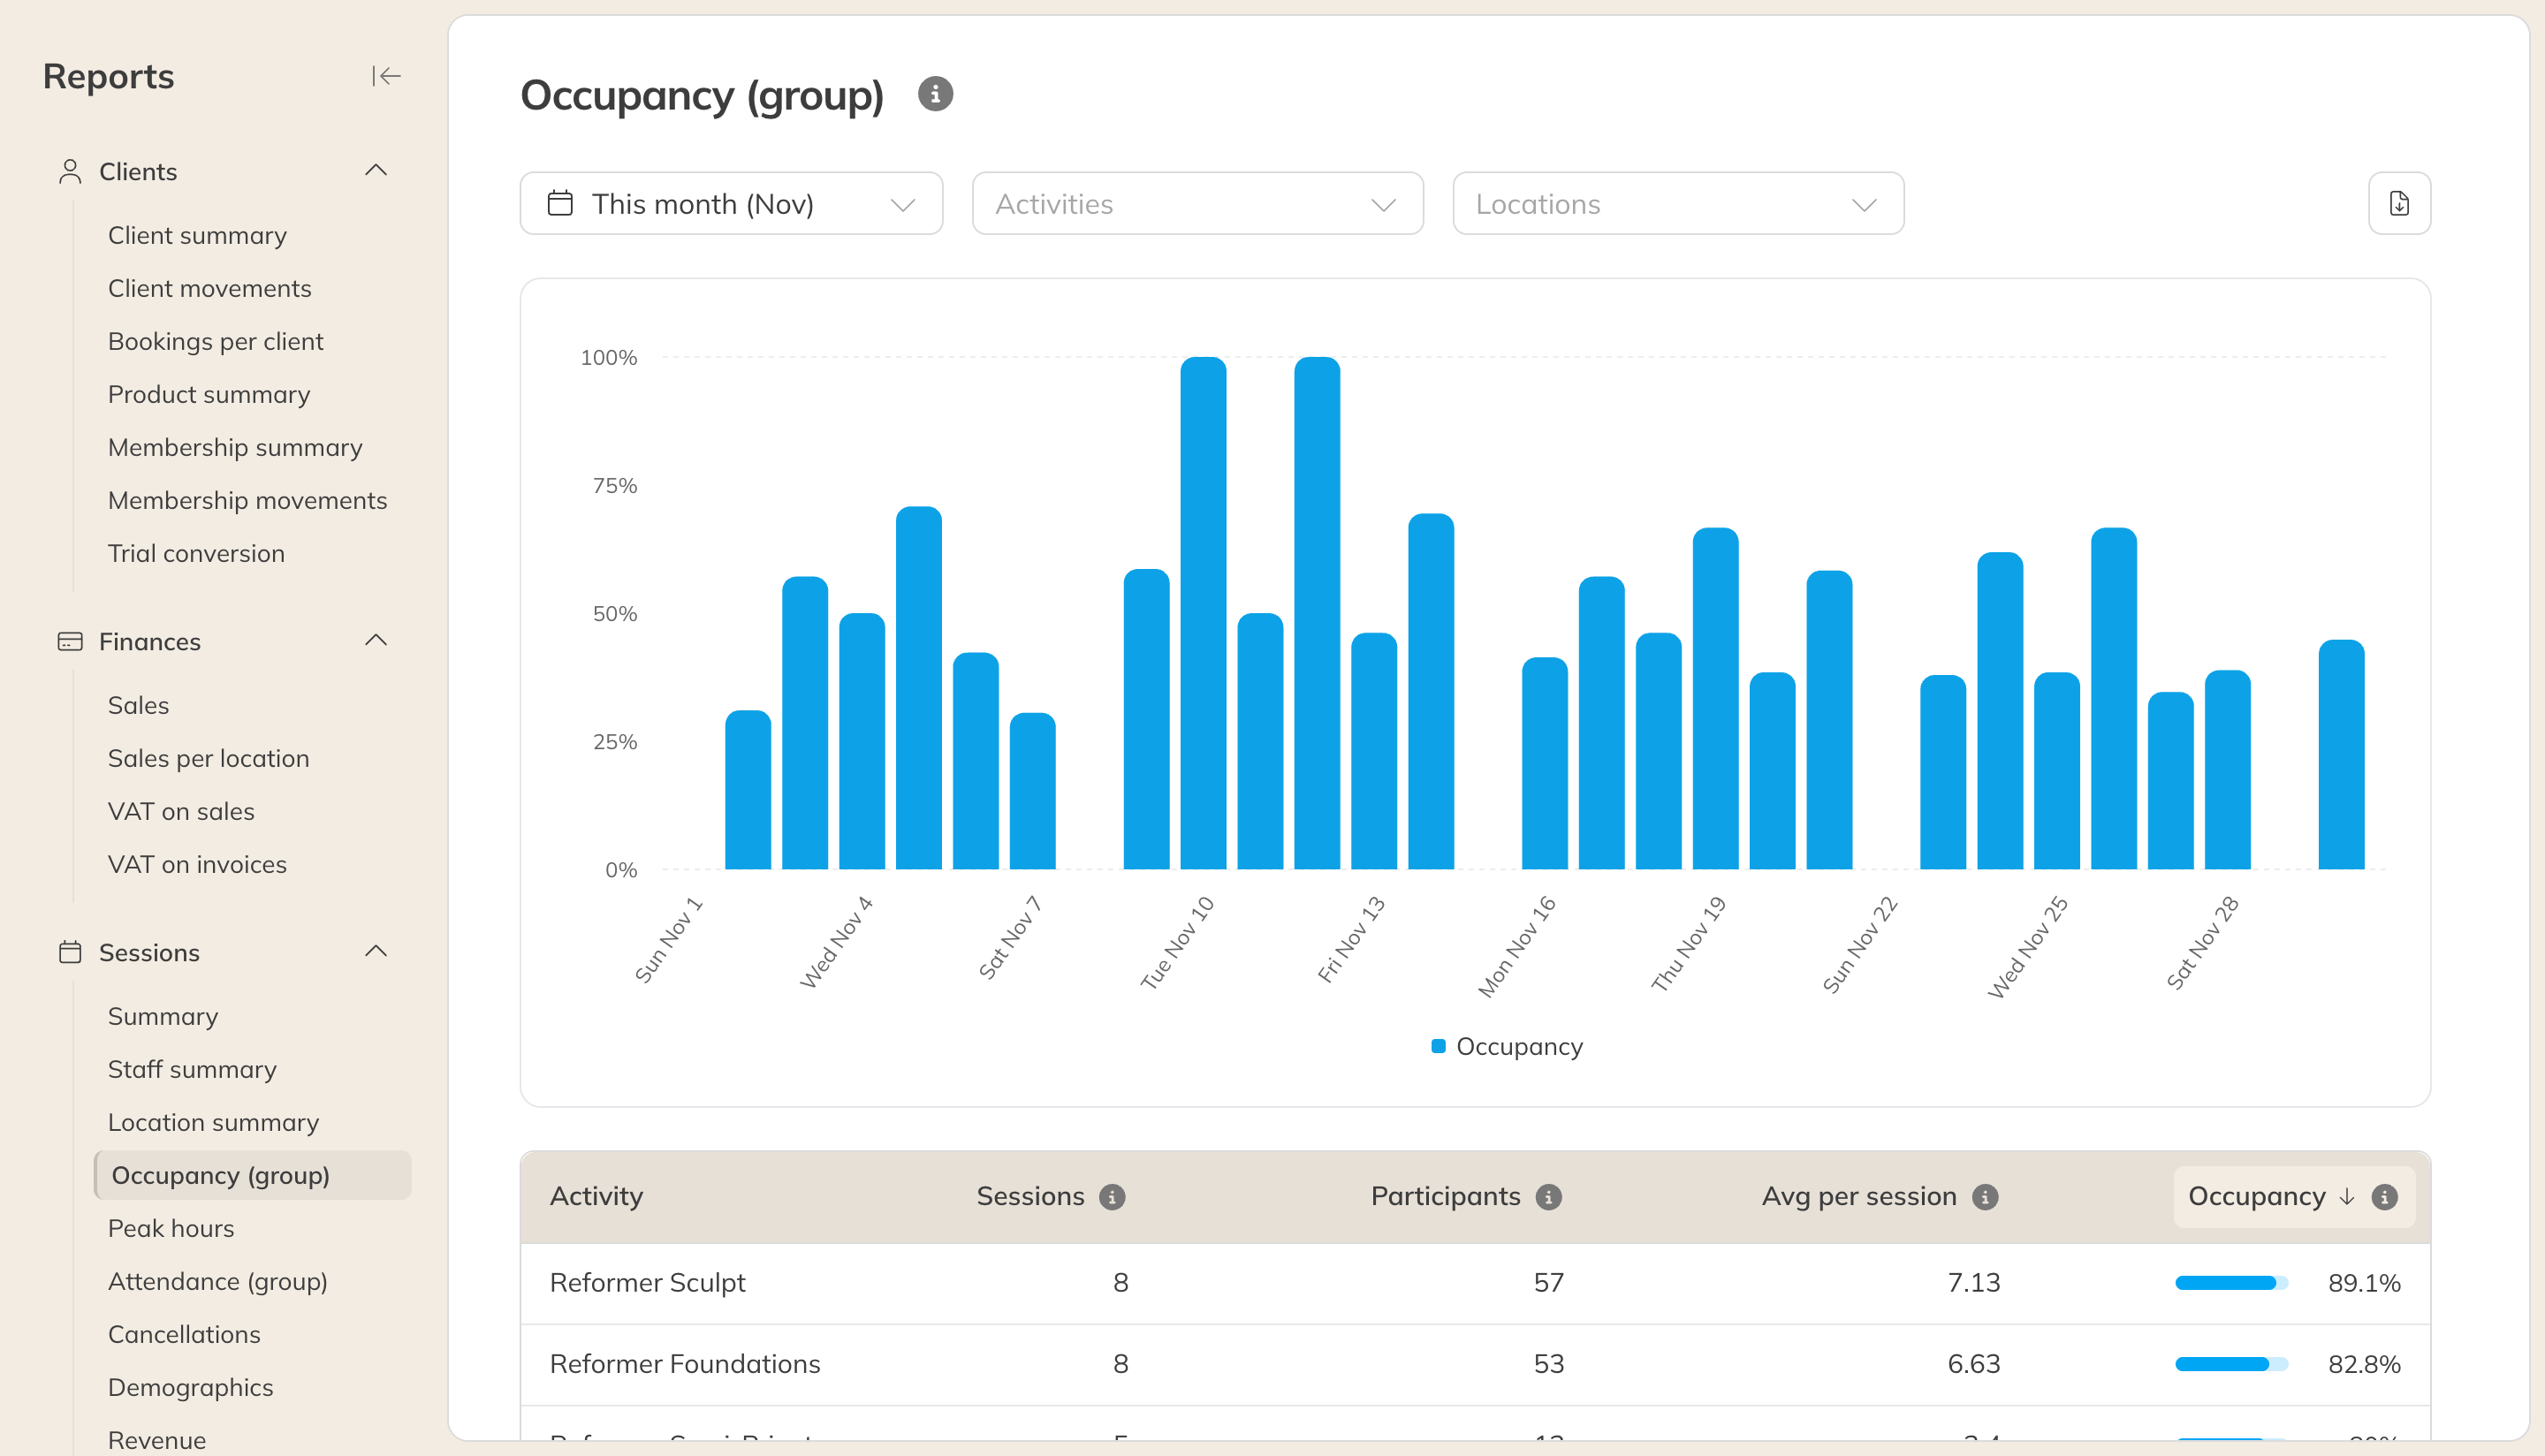
Occupancy (group)
Attendance (group)
How many of the people who booked a group session actually came. Someone counts as attended if they checked in or were marked as attended. For each activity you see Participants, Persons present and the Attendance as a percentage.
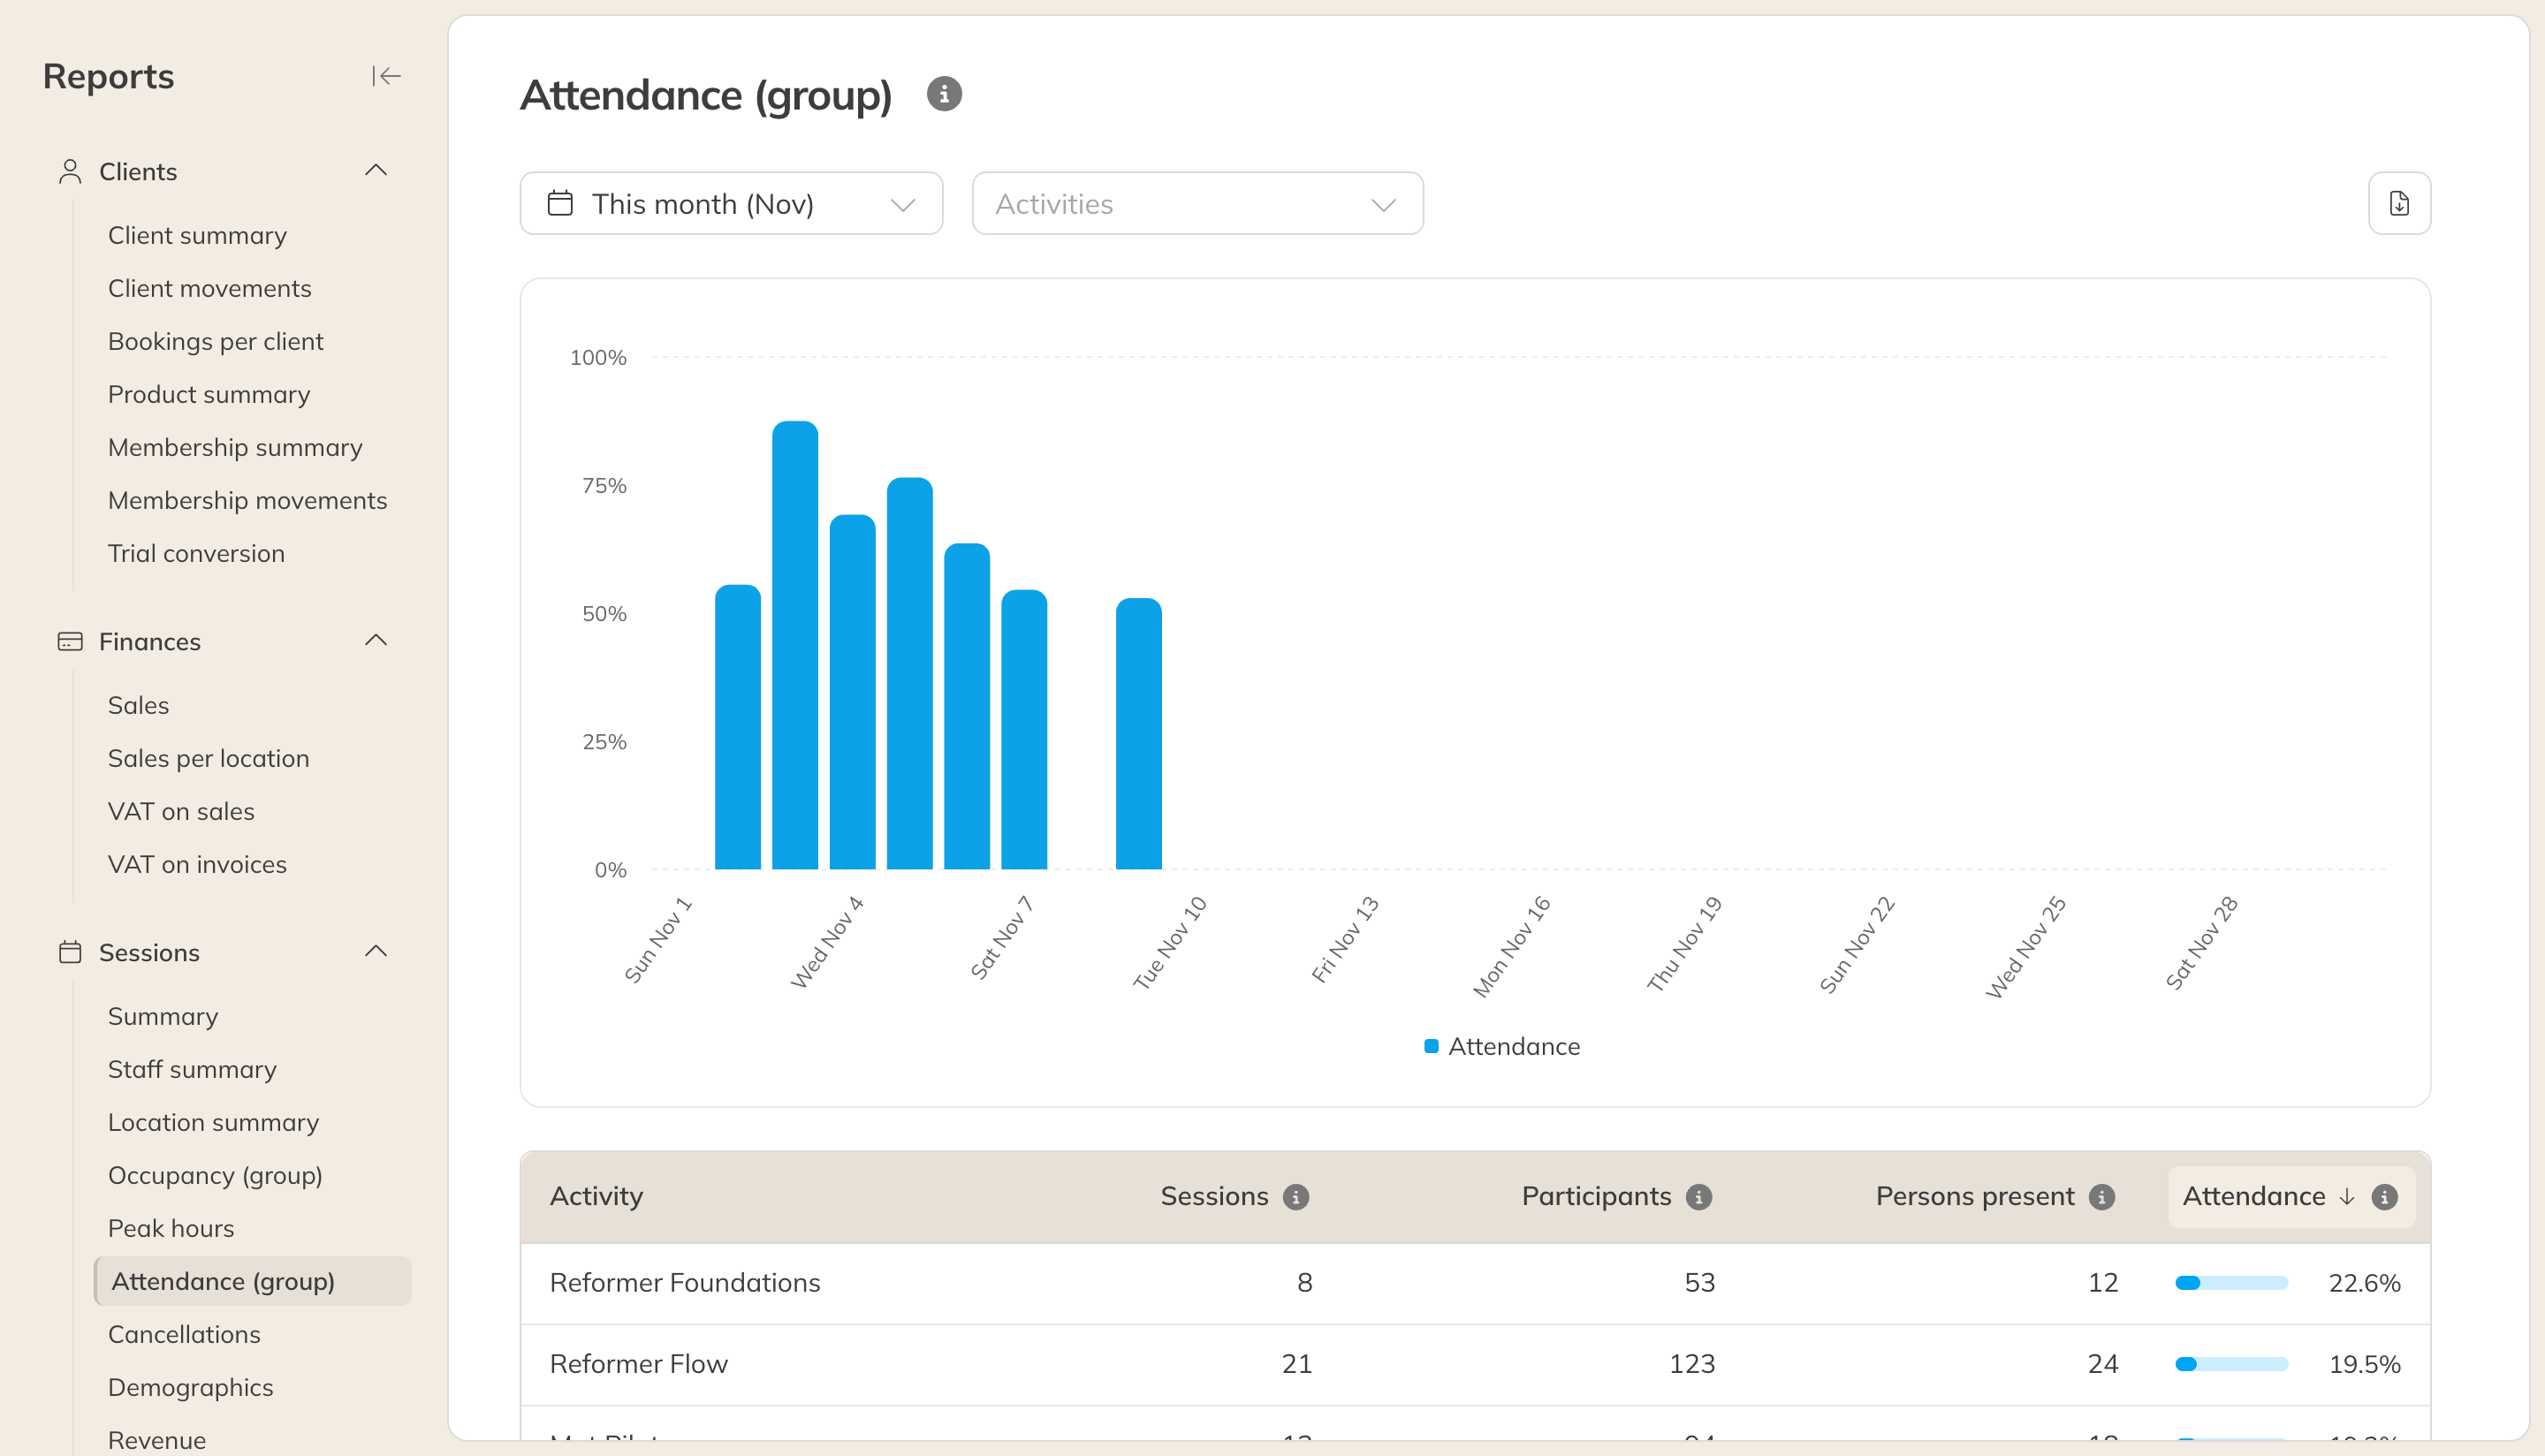
Attendance (group)
Note: This report is only as good as your attendance tracking. If you don't mark participants as attended, turnout will look too low. See Marking participants as attended by default.
Peak hours
A grid of weekdays and hours. At the top you switch between:
| View | What each cell shows |
|---|---|
| Bookings | The number of participants in sessions starting in that hour, added up over the period. All activity types count. |
| Occupancy | The percentage of spots taken in group sessions starting in that hour. |
| Check-ins | How many people checked in during that hour, including open gym. |
A session counts in the hour it starts: a class at 06:30 falls under 06. A shaded cell means there was no session. Below the grid you see the 10 Busiest or Quietest time slots.
With the All bookings filter you can also choose only the clients who attended, or only the no-shows.
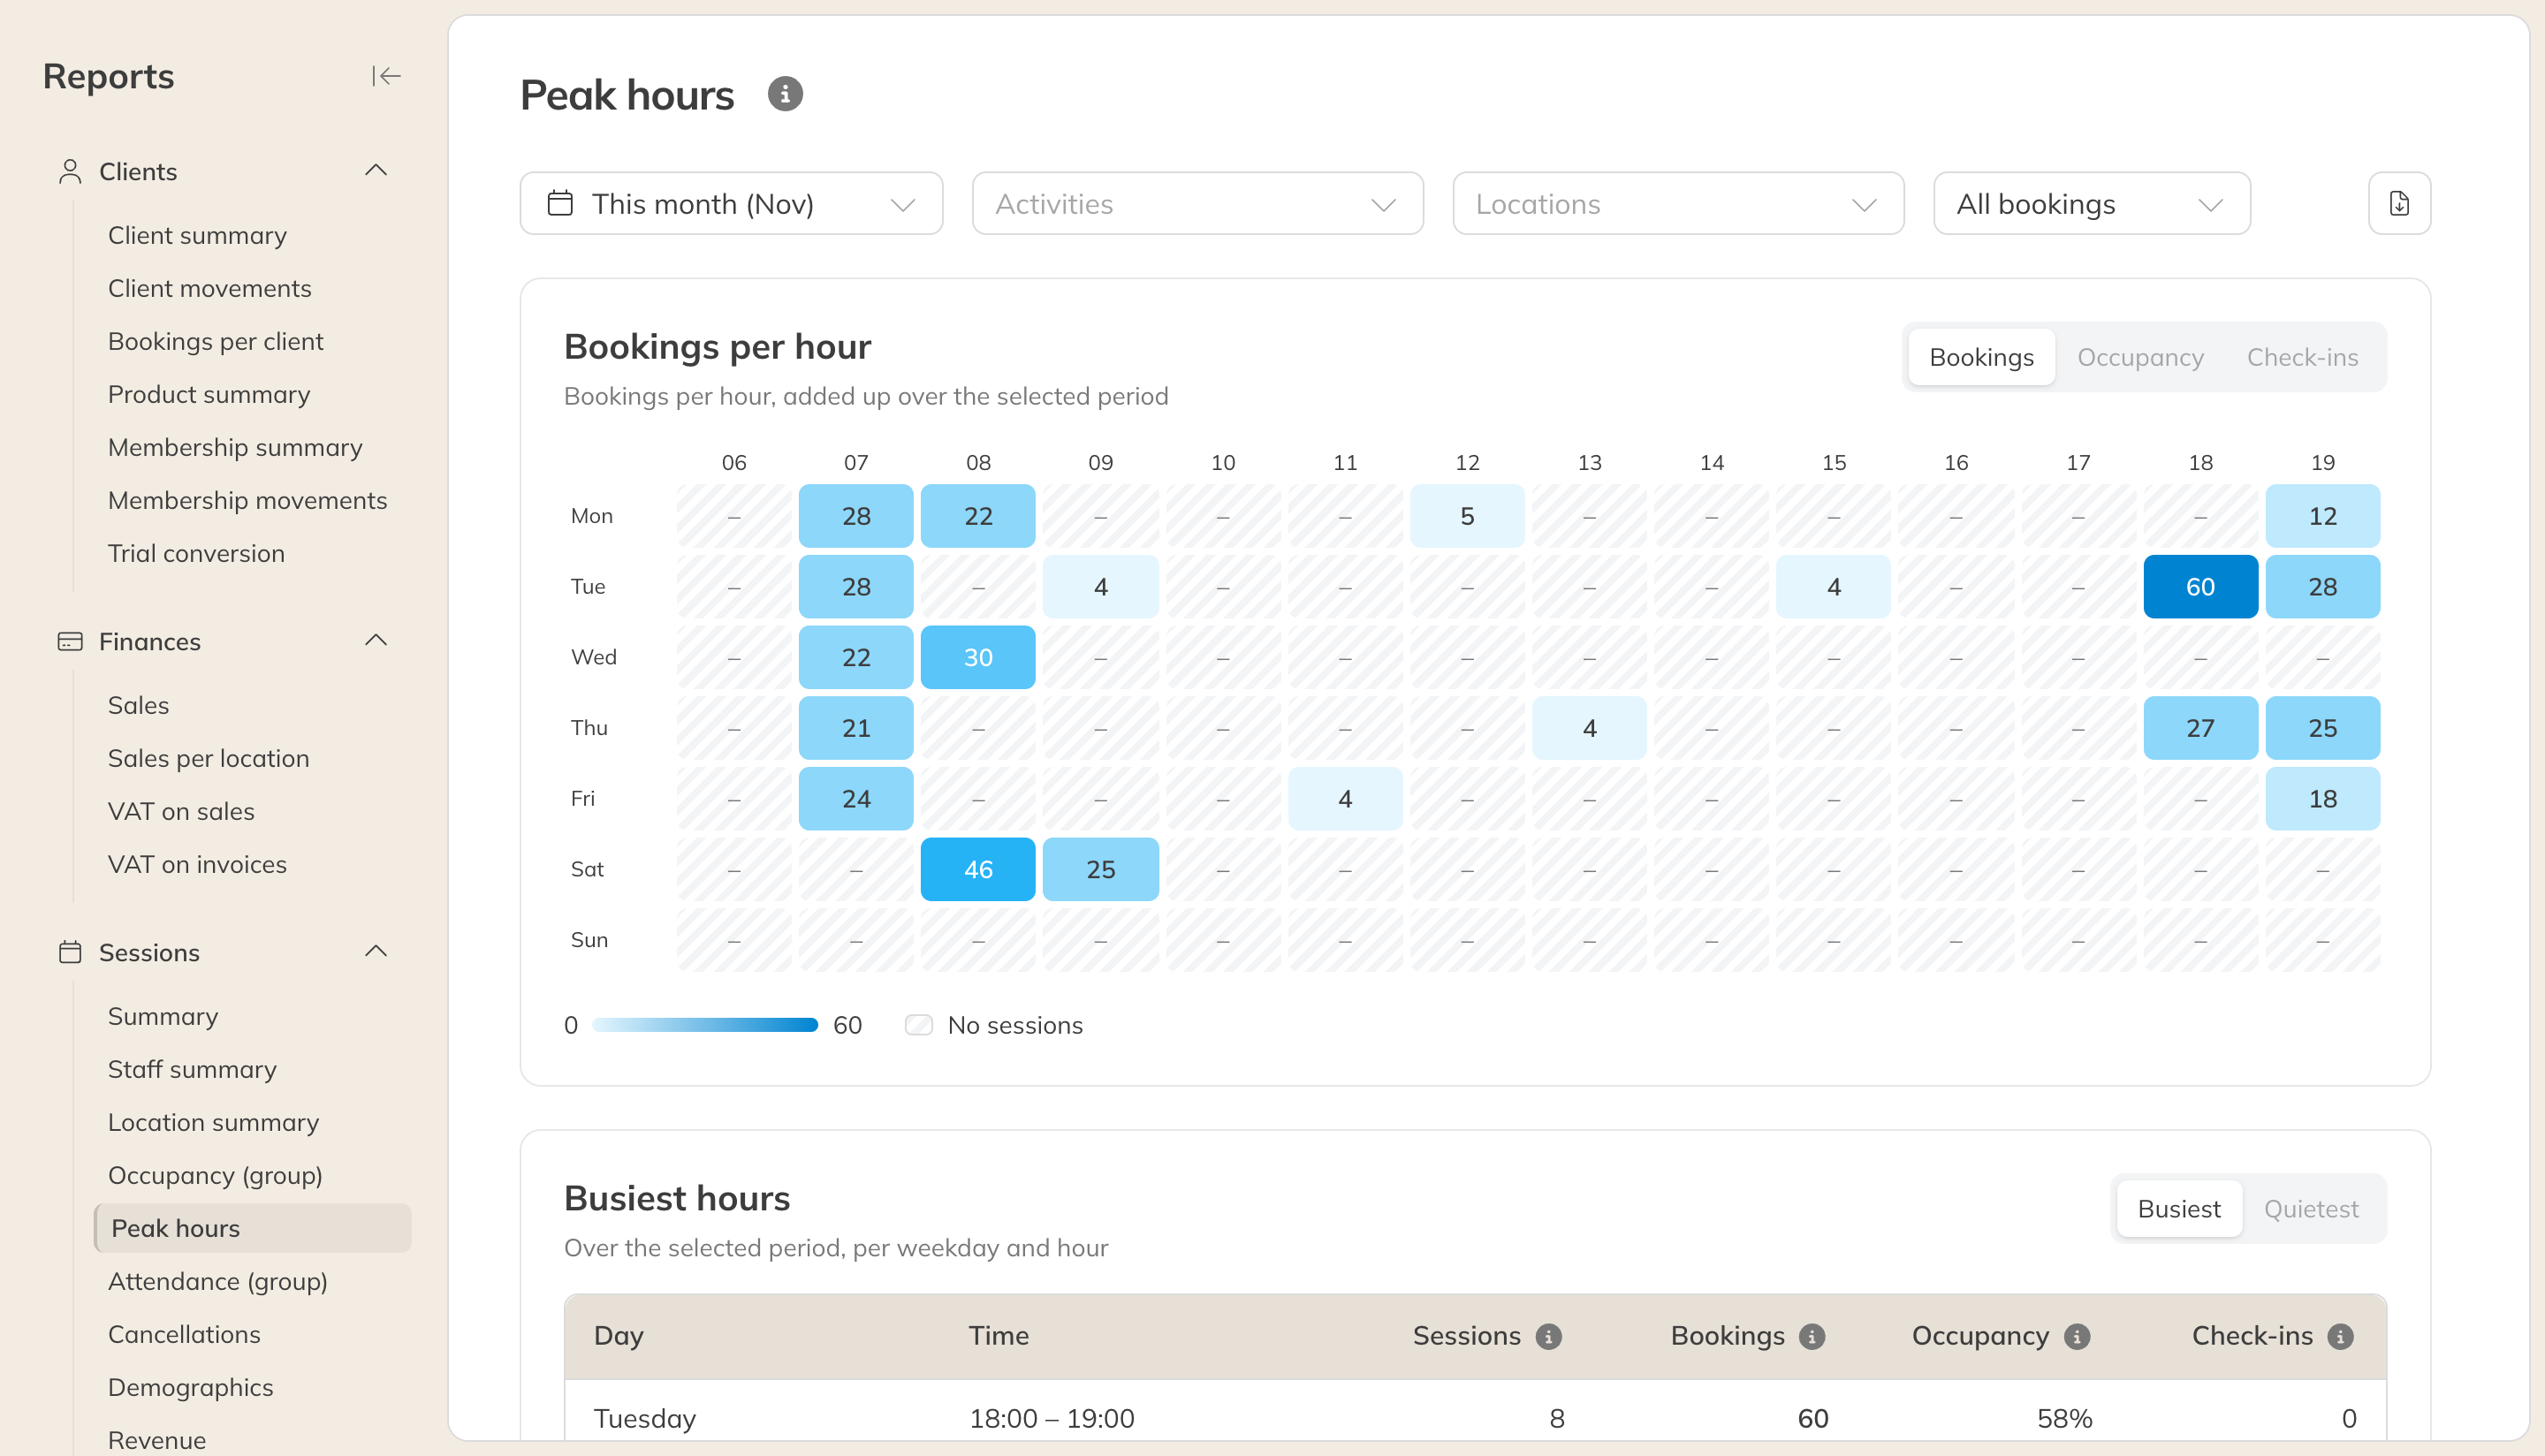
Peak hours
Tip: Private sessions and rentals have one spot, so they're always 0% or 100% full. That's why Occupancy and Attendance leave them out.