Click Reports at the top. On the left, the reports are split into three groups: Clients, Finances and Sessions.
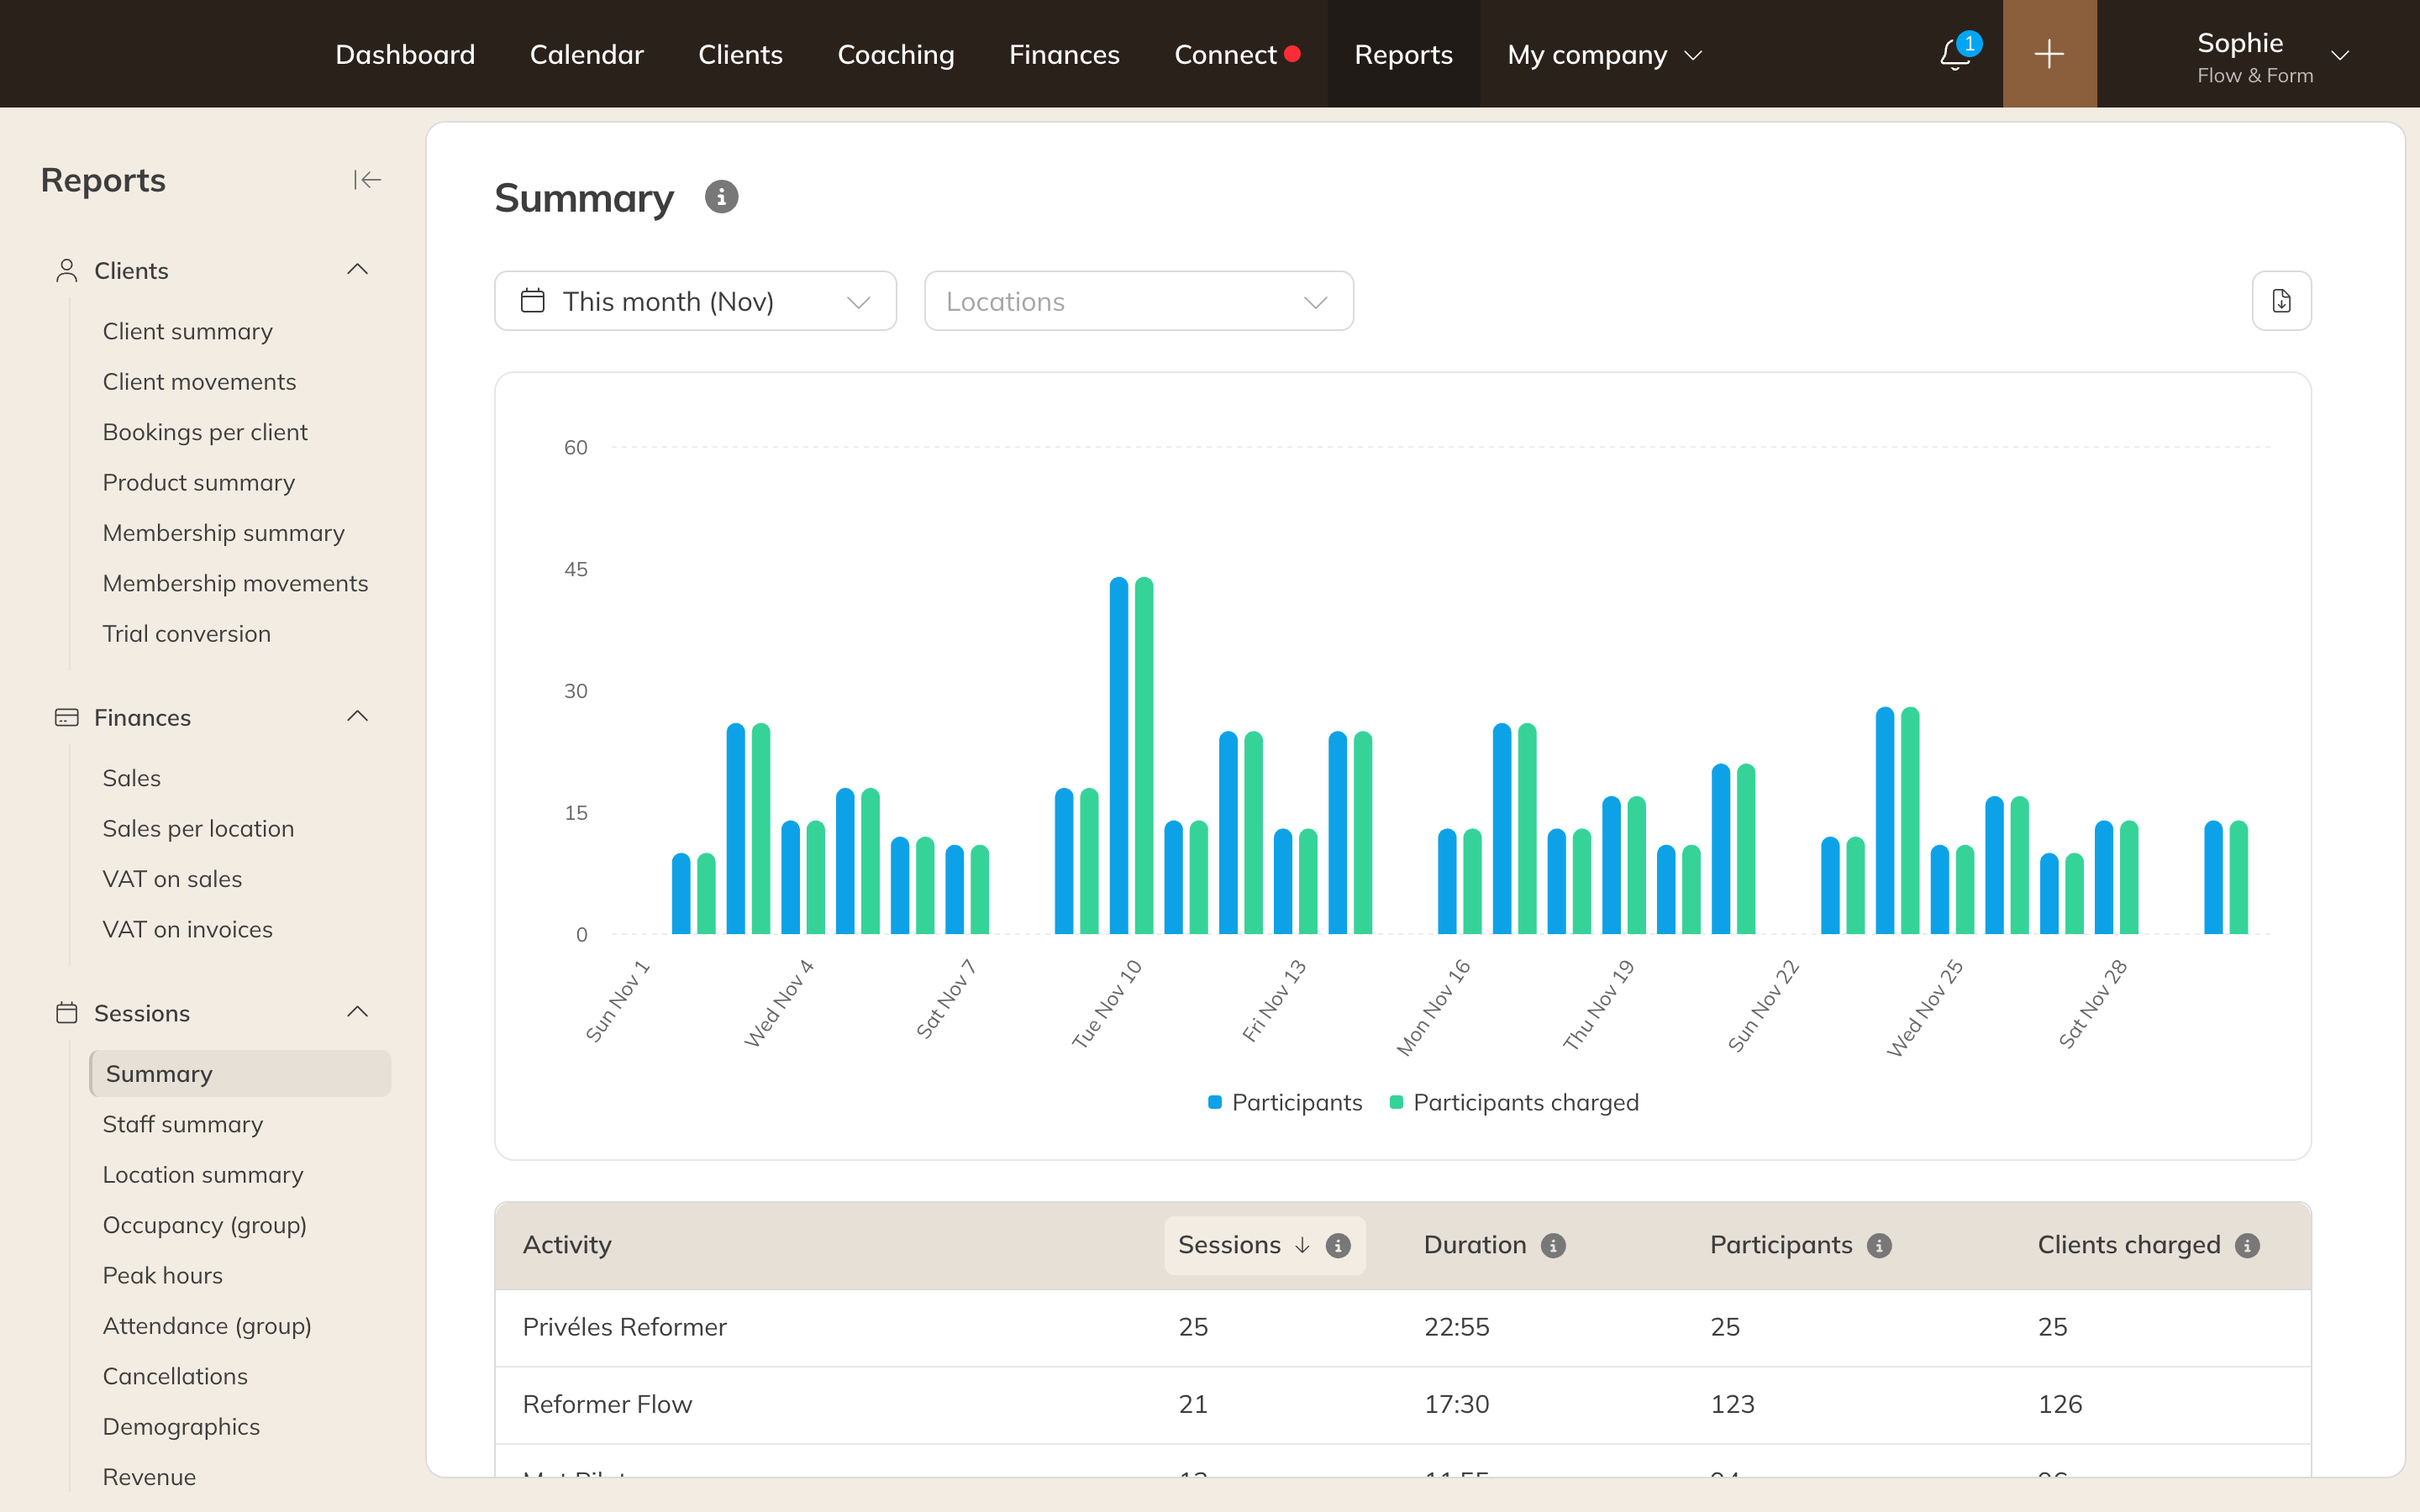
Reports, with all reports listed on the left
Which reports do you have?
The Starter plan includes Client summary, Sales, VAT on sales, VAT on invoices and the session Details. All other reports come with the Pro and Premium plans. On Starter you still see them in the menu, grayed out with a padlock.
Which reports a staff member sees depends on their permissions: View reports on clients and products, View reports on sessions and bookings and View reports on finances. With View report of own sessions and bookings, an instructor only sees the Staff report, showing just their own sessions.
Choosing a period
Click the period at the top left, for example This month. Choose a fixed period such as Last month, This year or Last 12 months, or choose Custom to set your own start and end dates.
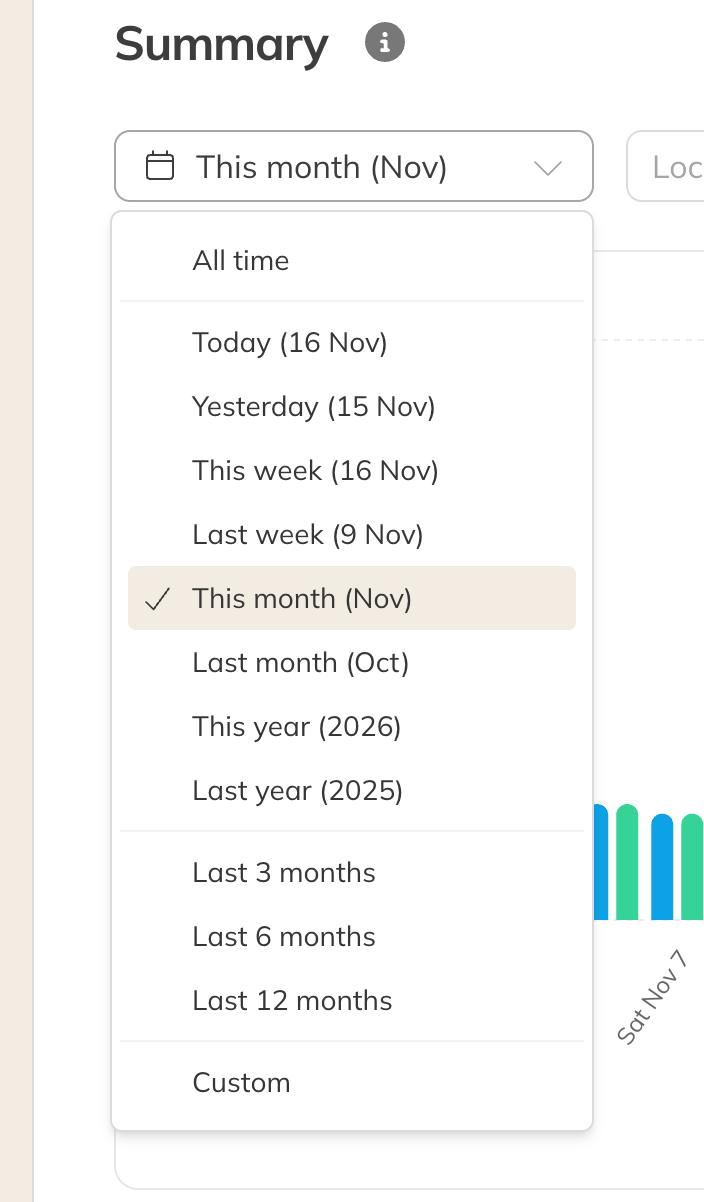
Choosing a period
Some reports show the situation on a single day, such as Client summary and Membership summary. There you pick a day instead of a period.
Filtering
Next to the period you'll find the report's filters, such as Activities, Locations or Staff. For locations you can also choose Not set, for everything without a location. The filters apply to the chart, the table and the export.
What is counted?
Click the i icon next to a report's title. It tells you exactly what the report counts and what it doesn't. The table columns also have an i with an explanation.
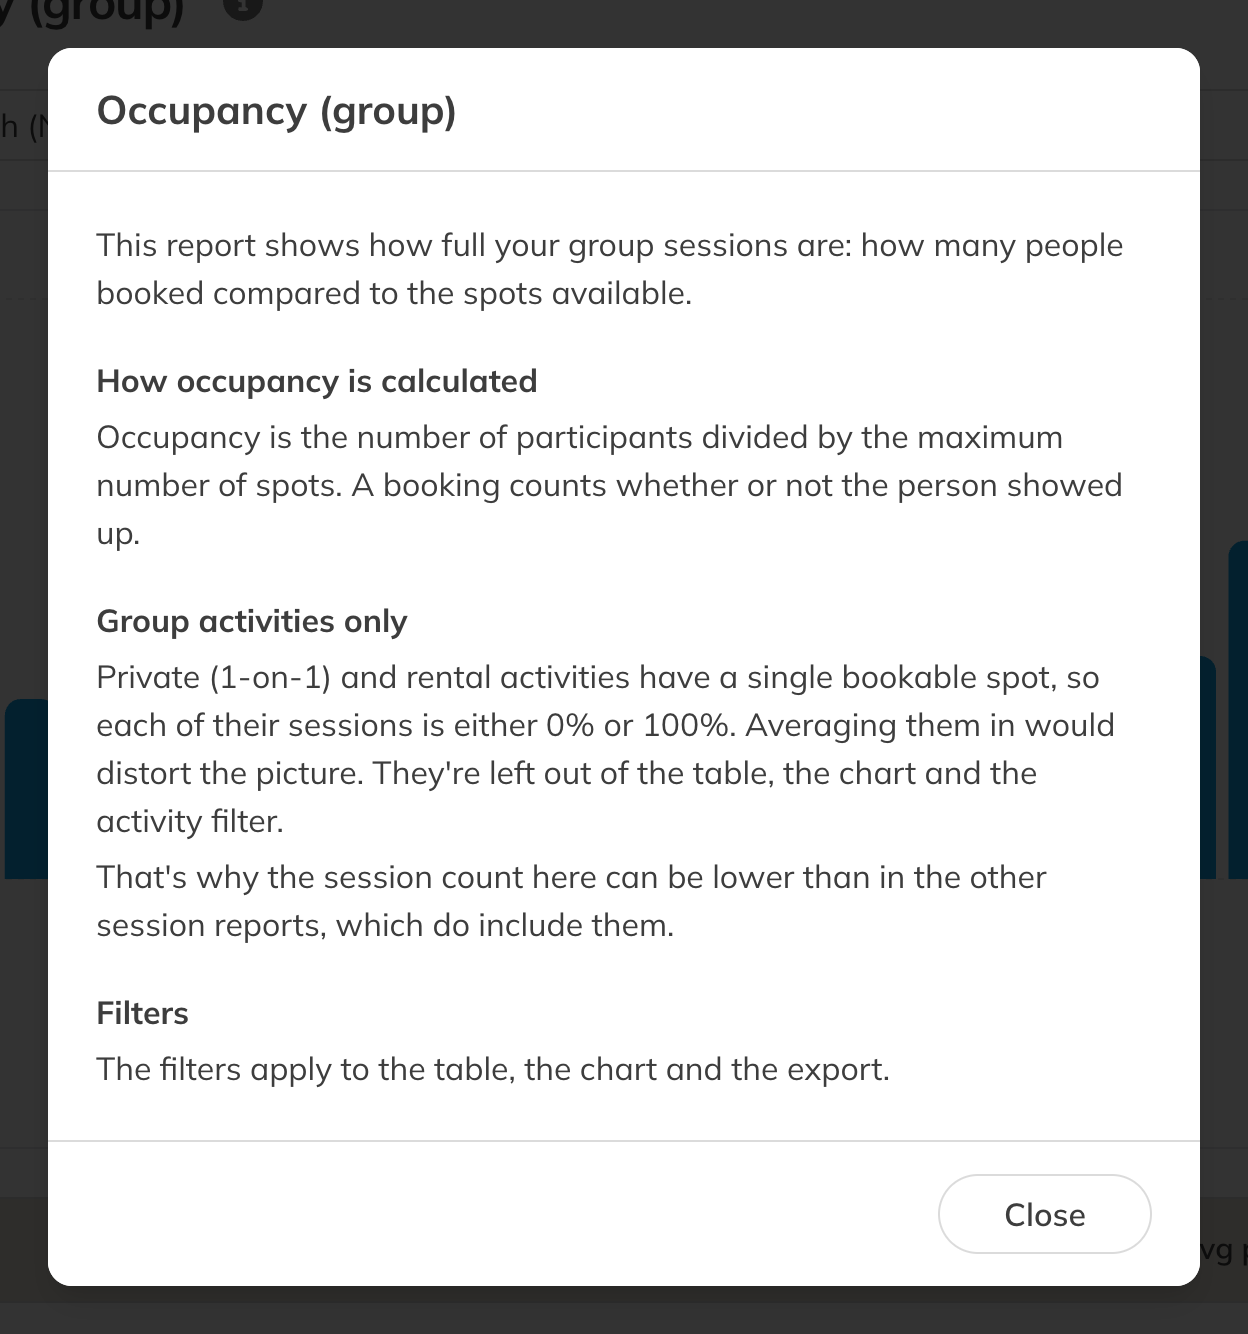
The explanation for the Occupancy (group) report
Exporting
- Choose the period and filters.
- Click the export icon at the top right and choose Excel or CSV.
- When the export is ready, you get a message under Notifications (the bell) with a link to download the file.